DELOITTE: JAM Competition 2020
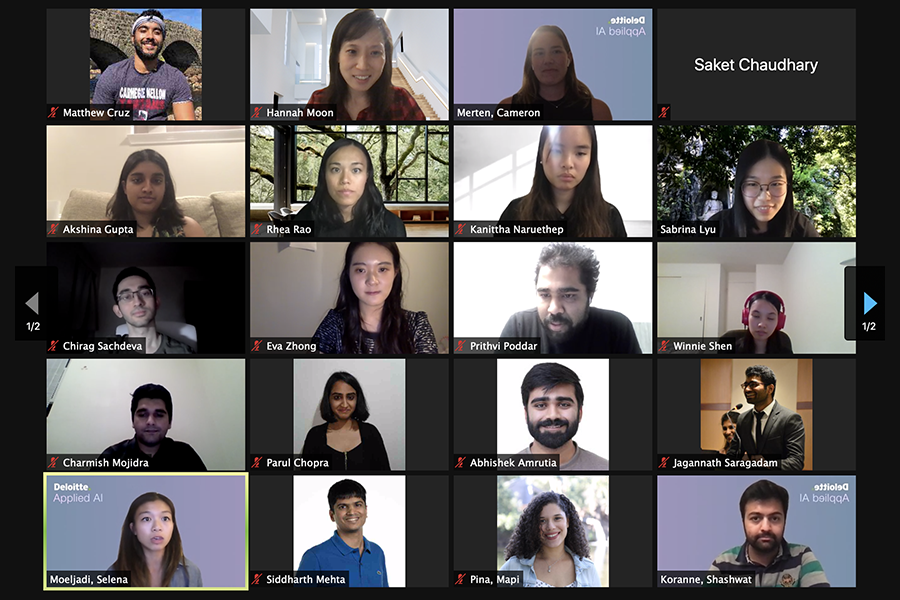
Won 1st Place
- Data Analysis
- Applied A.I.
goal
participate to win this competition
strategy
define a goal of A.I. model development opportunity rapidly by analyzing given data sets
What is the JAM?
The JAM case engages teams of data scientists, developers, and designers in a simulation-applied AI project. In 40 minutes, students need to brainstorm about the problem, do research, define a solution, and present an optimal suggestion. The solution should include data analysis, strong design thinking, and engineering architecture. Each team has 3 minutes to present.
How did our team reframe the prompt?
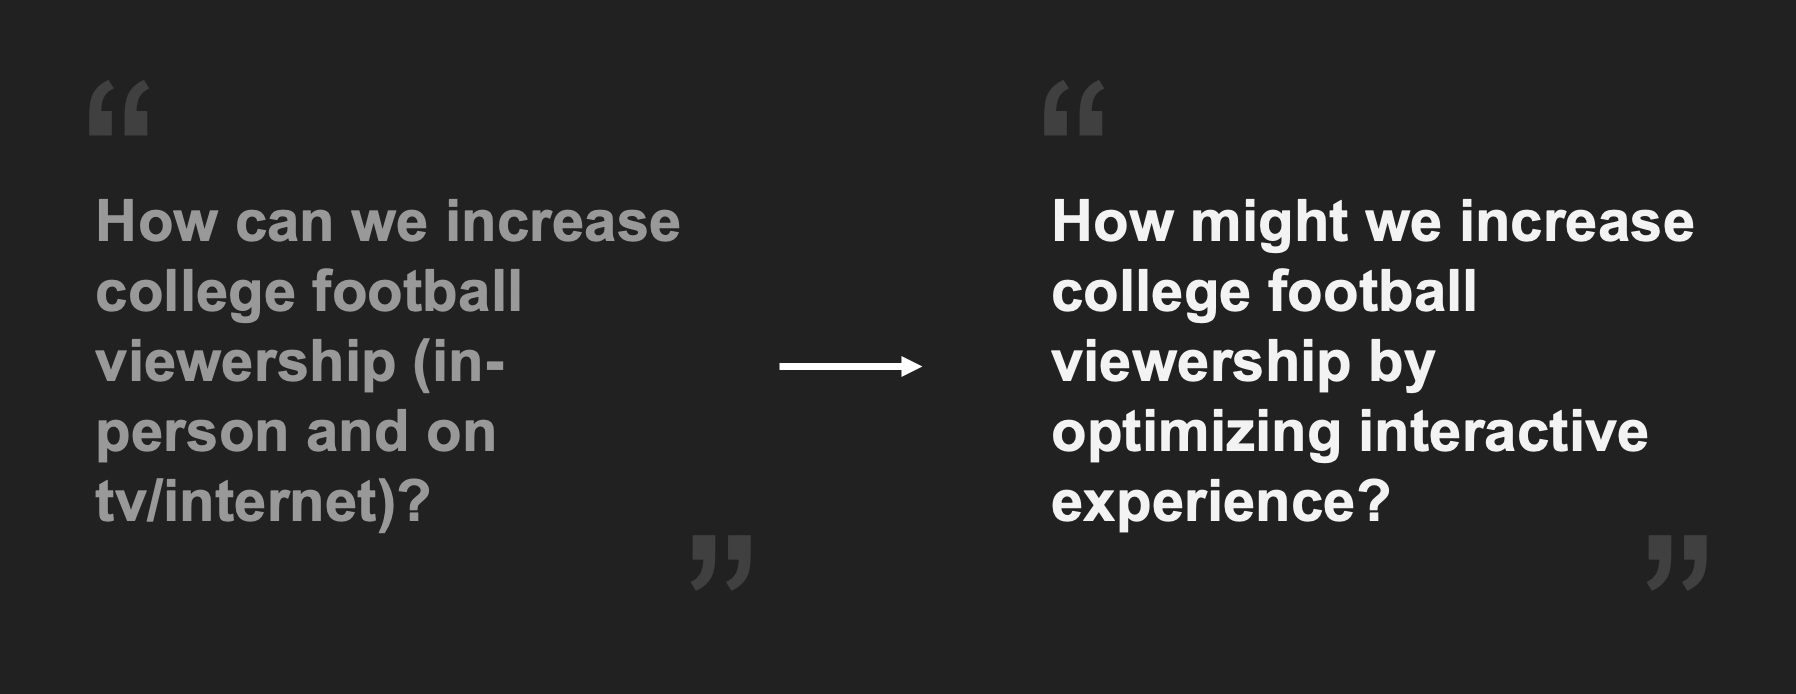
Our team began to define the root causes of the problem before we moved on to the research process. Then, the team analyzed the data supplied by Deloitte and dissected the problem: in our COVID-driven virtual world, how can universities increase student viewership of college football games? We spent some time reframing the question and found ourselves asking how we might increase viewership by optimizing interactive experiences. The judges from Deloitte really liked how we reframed the problem statement because we embodied a human-centered design methodology to frame the problem.
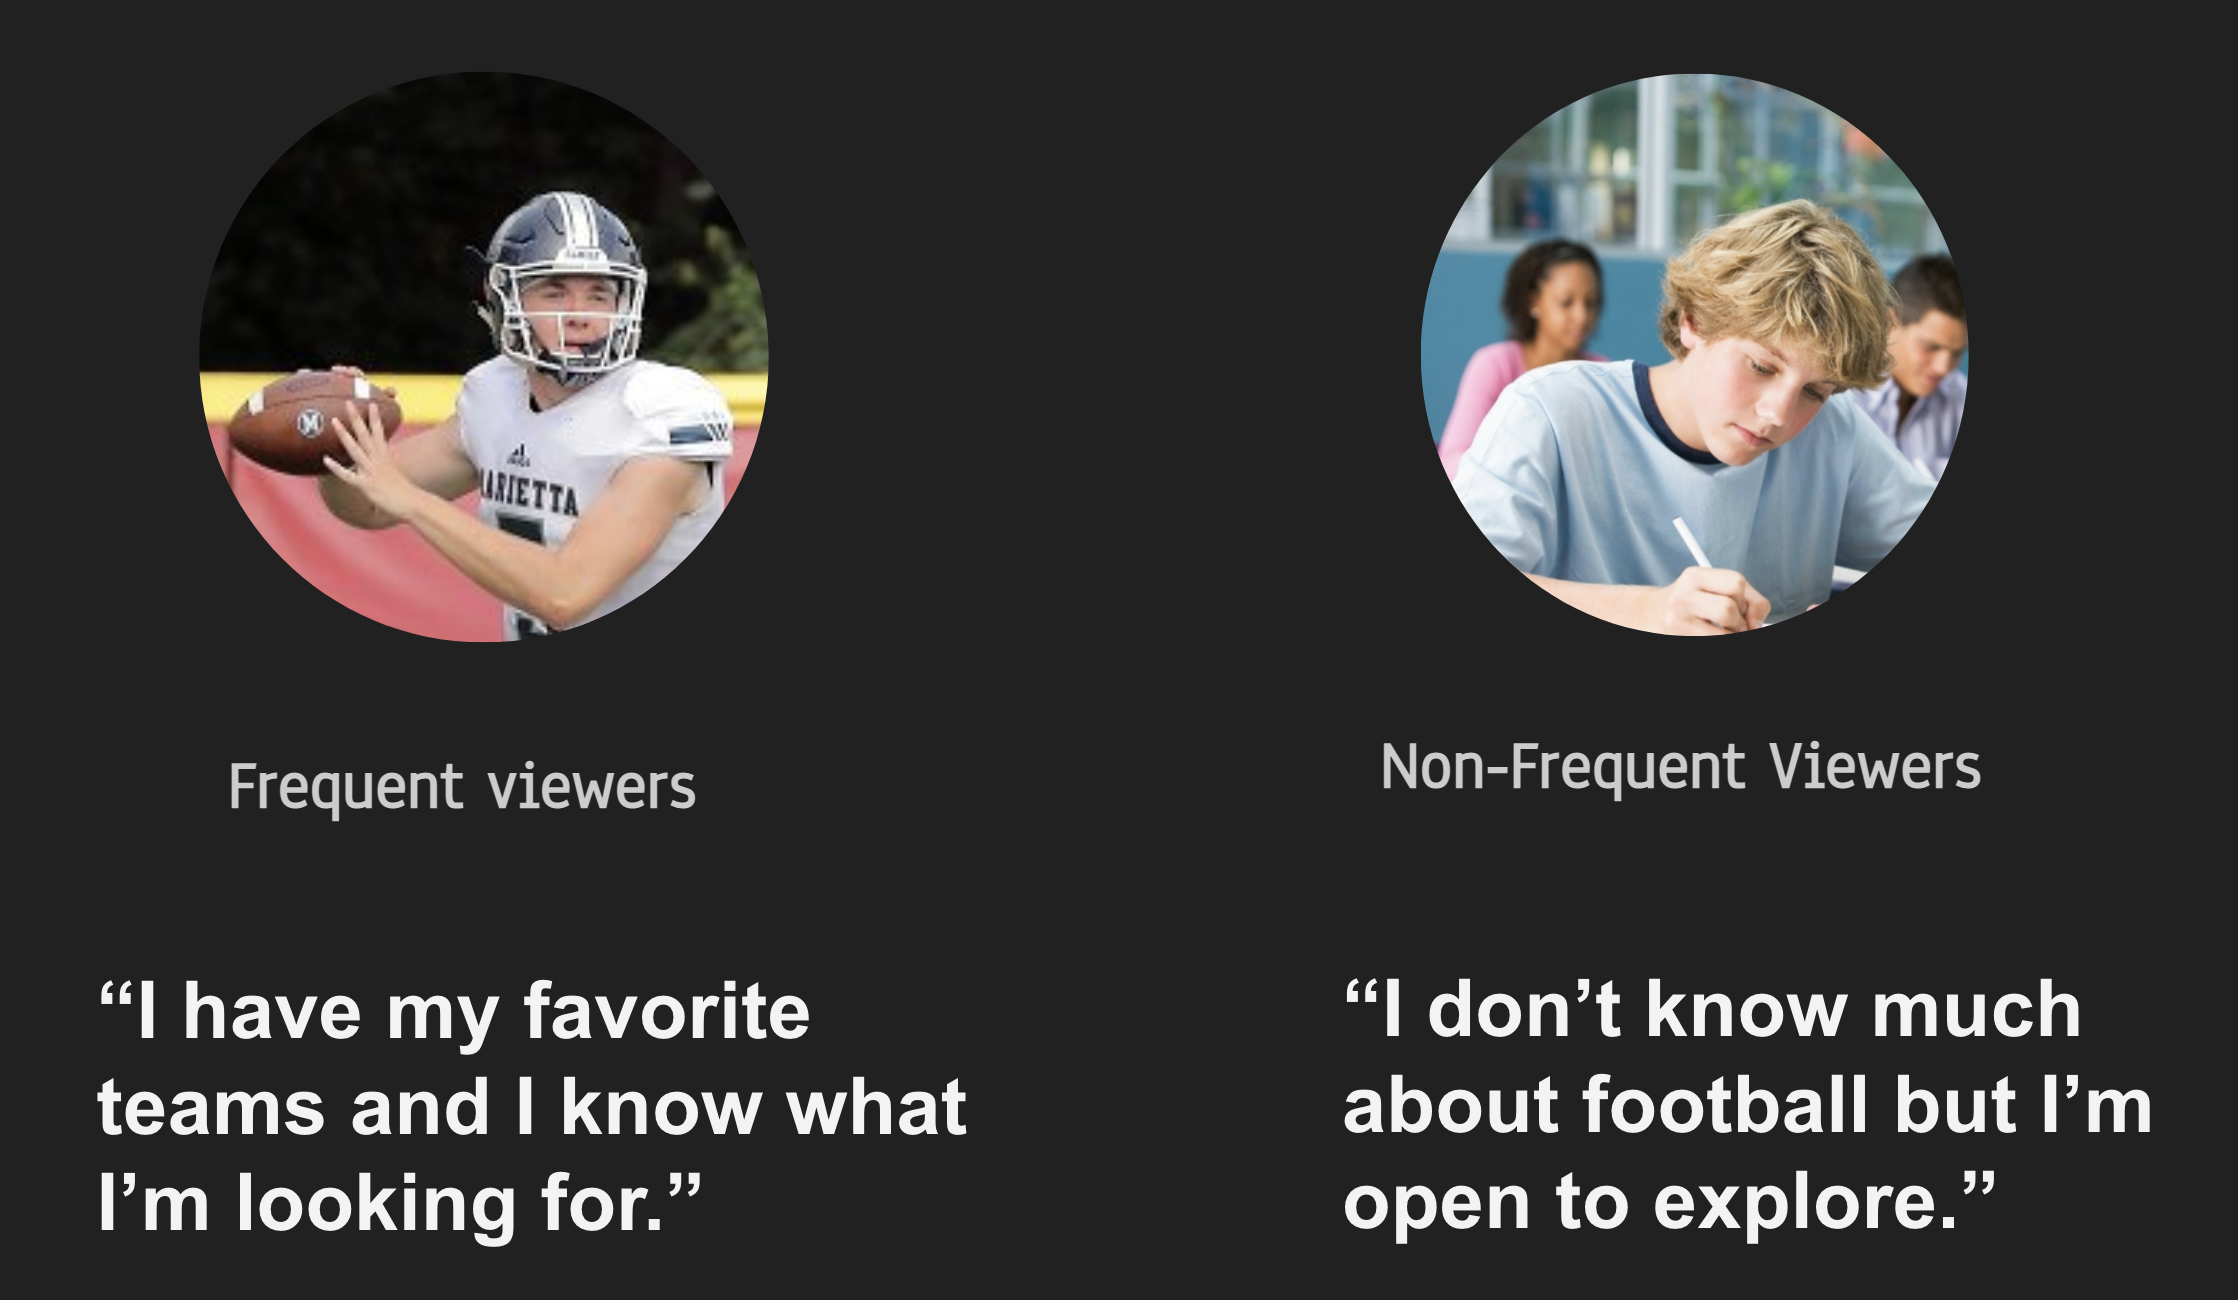
Who is Persona?
Our team began to define the rooted causes of the problem before we move onto the research process. Then, the team analyzed the data supplied by Deloitte and dissected the problem: in our COVID-driven virtual world, how can universities increase student viewership of college football games? We spent some time reframing the question and found ourselves asking how we might increase viewership by optimizing interactive experiences. The judges from Deloitte really liked how we reframed the problem statement because we embodied a human-centered design methodology to frame the problem.
Data Analysis?
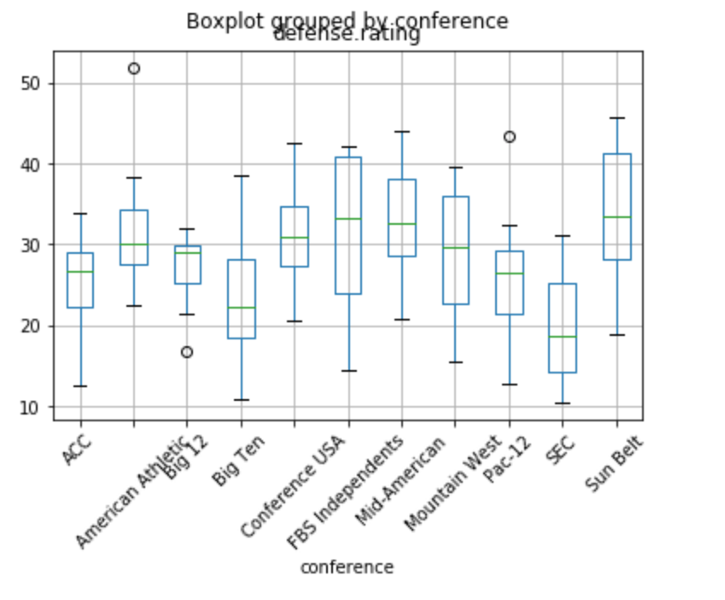
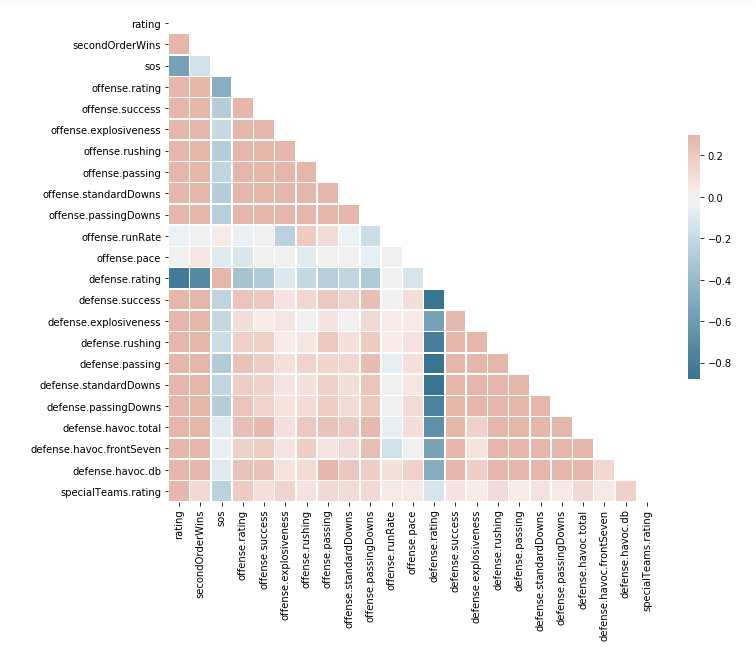
The team decided to use a regression model for data analysis because it can be designed to identify both the two personas we defined. We envisioned finding a correlation between different factors that can drive the regression output. We first developed a boxplot to have information on the variability or dispersion of the data. It gave us a good indication of how the values in the data are spread out.
Suggested Solution
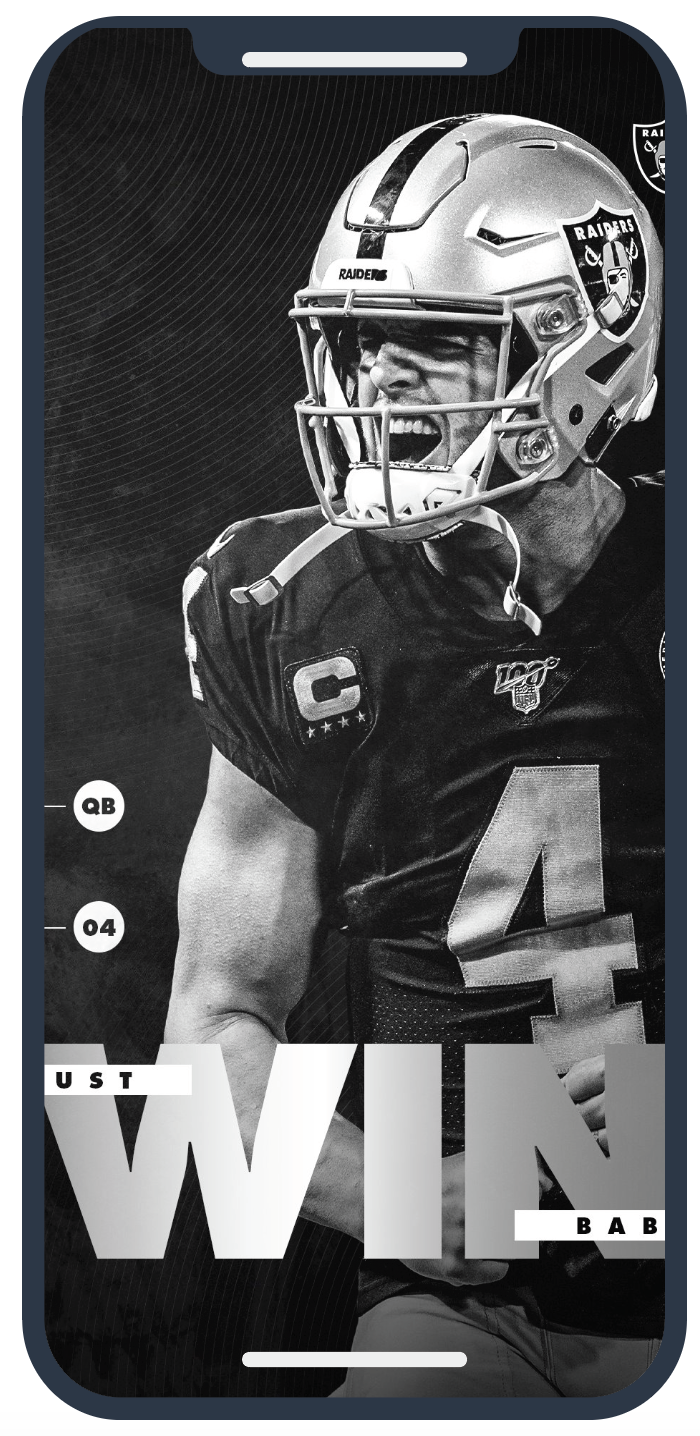
The data analysis inspired us to create a real-time winner prediction game. Before games begin, the viewer can predict the game scores and main contributors to win the games. The game can only be played when it is on air in order to boost live viewership. If viewers can predict the game based on the live show with analytic report they can refer to predic a winner, it can be more fun than just watching games. By applying intuitive and clean UI/UX, we designed to make the UI interface easy for viewers who are new to the game prediction game.
Personal Takeaway
It was a great experience to win the 1st place and work in a really friendly environment. Even though we were competing against each other, it was a friendly yet comfortable atmosphere. Our team was creative and collaborative while integrating design, data science, and development concepts together. To read more about the competition, please click here.

